


Engine Builder Professional is an easy to use engine building software tool for 8, 6, 4, 10 and 12 cylinder engines. It was developed to allow the user to fully optimize the selection of engine components and engine settings for the ultimate engine build. The simulation was validated using several engine configurations, by comparing with actual dyno results. Two example engines are provided, the LS7 427 engine, and LS9 Supercharged 427 engine, to help with the validation and to show how typical values are entered in an easy to read GUI format -- Block components, Cylinder Head specifications, including flow characteristics, Camshaft specifications, Intake & Exhaust, and Chassis & Drivetrain. All information is readily available from component manufacturer’s websites and your own personal design details. For the sample engines provided, nearly all information was obtained on the Internet. Necessary information not obtained was estimated or assumed. Also entered is engine setup information, such as head gasket thickness, cam and ignition timing, and more, giving you the information you need to optimize your build.
Product User’s Manual
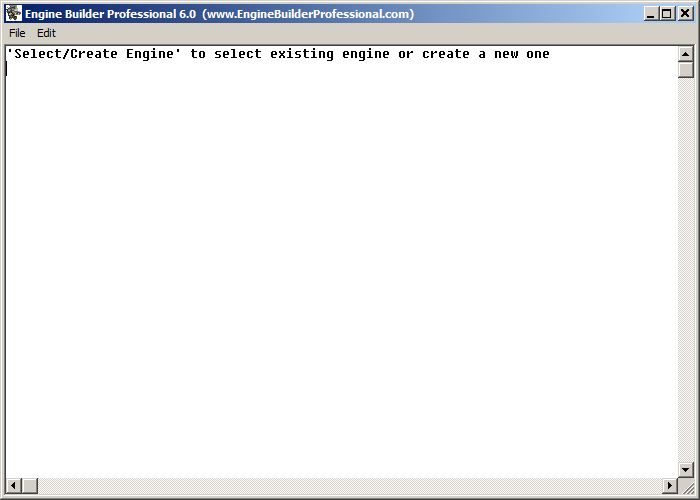
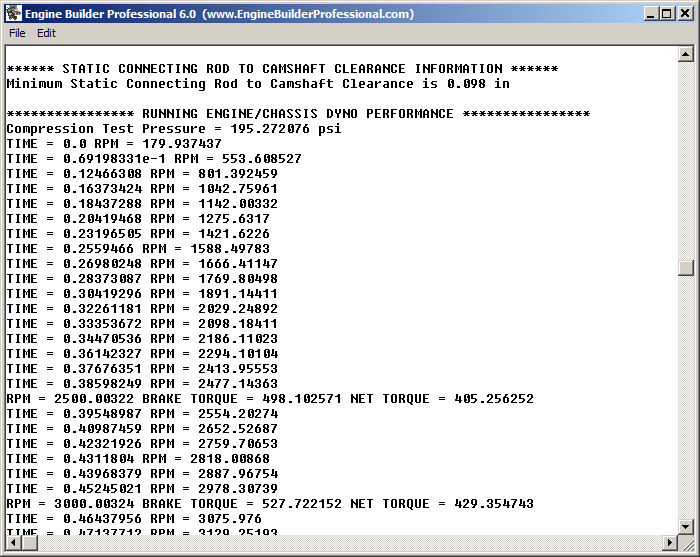
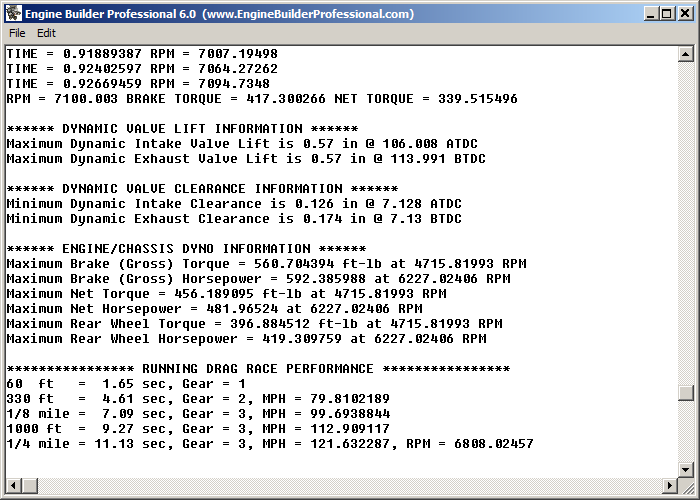
Double-click on the application and 2 windows appear. The first one, the simulation window, writes out informative information as the application runs.
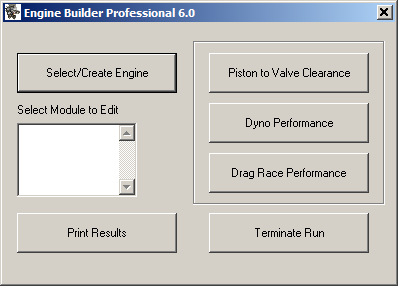
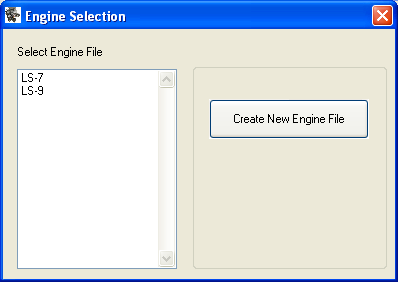
The second and remaining windows are user driven GUI’s. The first GUI that comes up is the main engine selection or creation window. We will start by selecting “Select/Create Engine”
The next window shows the provided example engine files. You can also create a new engine file and save it with your own name. When you have more engine files to choose from, it may be more convenient to select the closest engine in the list to the new engine you want to create to load the fields before hitting the “Select/Create Engine” button again to create your new engine.
For display purposes we will select LS7 now by clicking on it.
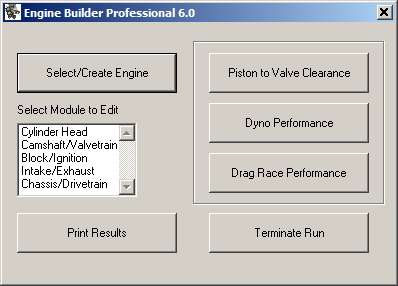
Now you will see the 5 modules that were entered for this engine: Cylinder Head, Camshaft/Valvetrain, Block/Ignition, etc. We could hit the Piston to Valve Clearance button now to compute the necessary parameters for Dyno Performance and then Drag Race Performance, or we can review the populated fields of each module which we will do now.
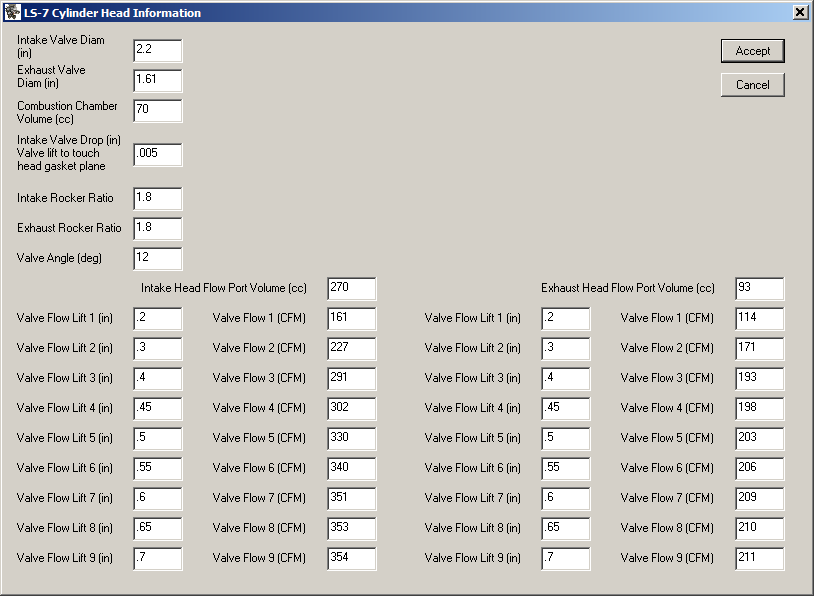
Click on “Cylinder Head”, notice the Intake Valve Drop. This is needed for piston to valve clearance and is a number that is obtained from the head manufacturers. If it’s not available on the Internet, call up the head manufacturer and ask them. Or, you can measure it yourself. If you were to place the head on a table with the springs up and disconnected one of the intake springs and let the valve drop, this would be the distance it would fall from the seat before hitting the table. 9 breakpoints are given for intake and exhaust head flow at a pressure of 28” water -- this too is readily available from the head manufacturers.
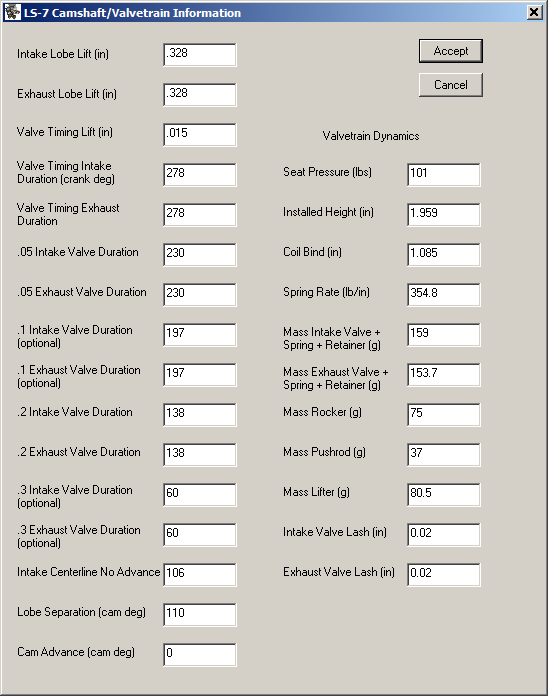
For the Camshaft/Valvetrain module all the durations and the intake centerline with no advance are in crank degrees. The lobe separation and cam advance are in cam degrees. Notice also that the durations for 0.1 and 0.3 lift are optional, but will improve accuracy if entered. A 6th order polynomial-spline fit is used to approximate the lobe profile in between the points entered to get a better estimate of the piston to valve clearance through the complete engine cycle. Look at your cam card and lobe tables available -- Comp Cams Isky Cams Crane Cams, especially for the .2 durations. This particular cam is set centered at 0 degrees advance. Cam timing plays an important role in engine performance and piston to valve clearance. Advancing the cam increases the dynamic and effective compression ratios, but decreases intake clearance and increases exhaust clearance. Retarding the cam does the opposite.
Notice also the “Valvetrain Dynamics” block. This information is needed to include the effects of valve float if it occurs, for determining the dynamic piston to valve clearance and valve lift. Valve float can occur if the valve springs in the head are insufficient in force to close the valves in agreement with the camshaft, affecting performance and possibly causing severe engine damage. “Seat Pressure” refers to the force required to just barely open the valve. The “Installed Height” is the height of the spring with the valve closed. “Coil Bind” refers to the minimum height of the spring before binding of the spring occurs. “Spring Rate” is the amount the force increases in pounds per inch of spring compression. Masses in grams are also needed for the valves, springs, retainers, rockers, pushrods, and lifters, for modeling the Valvetrain Dynamics. These values were estimated for the most part for the LS-7 engine, but would be adequate. Intake and Exhaust Valve Lashes were included to more accurately determine total lift and intake and exhaust clearances.
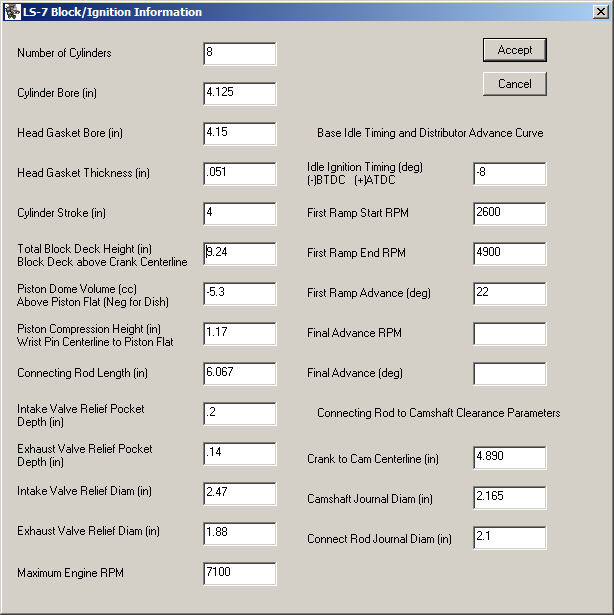
For the Block/Ignition module, the “Total Block Deck Height” entered represents the distance from the crank centerline to the top of the block. The program can handle flat-top, domed, or dished pistons. The piston manufacturers give you the dome volume in cc’s, which can be zero, negative, or positive, and includes the valve relief volumes. The pistons entered below are flat top with 5.3 cc of valve relief volume, so a -5.3 is entered. For clarification on the pocket depths, refer to this. Notice that the pocket depth is given relative to the piston deck (flat portion) of the piston. This is used to estimate the piston to valve clearances and compression ratio. Valve relief diameters must be larger than valve diameters for obvious reasons. Even with flat top pistons, it’s still STRONGLY recommended that clay be used as the final say for estimating intake and exhaust piston to valve clearances. This is why entering the correct pocket depths (the depth below the flat portion of the piston where the valves would go) is so important. Otherwise you could be wasting your money on parts that don’t fit. If you don’t know, ask the piston manufacturer!
A sample of “Base Idle Timing and Distributor Advance Curve” information has been entered for this engine for completeness. Essentially, the “Idle Ignition Timing” is the timing you get with a timing light at idle. This one is 8 degrees advanced, indicated by -8. The distributor typically also has an additional advance that is either vacuum or mechanical. This LS-7 is really tricky, because it has a timing map which is a function of many parameters not modeled here. In any case, to reasonably estimate performance it is paramount to know the timing as a function of RPM. For simplicity, a sample timing ramp was used here with a total advance of 30 degrees at 4900 RPM, which includes the idle advance and the “First Ramp Advance.” The program will also allow you to put in a Hop-Out curve with a second ramp ending at the “Final Advance RPM”, and remaining constant from then on. This program also estimates connecting rod to camshaft clearance from stroke, connecting rod length, crank to cam centerline distance, camshaft journal diameter, and connecting rod journal diameter, detailed later.
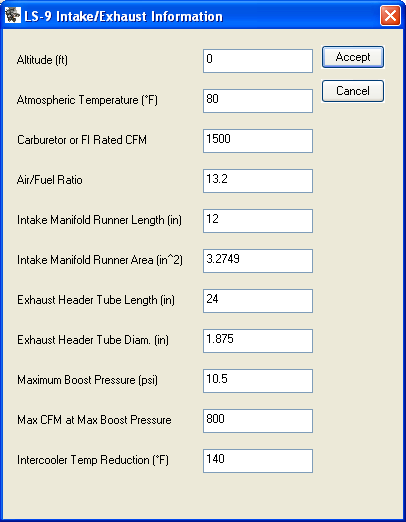
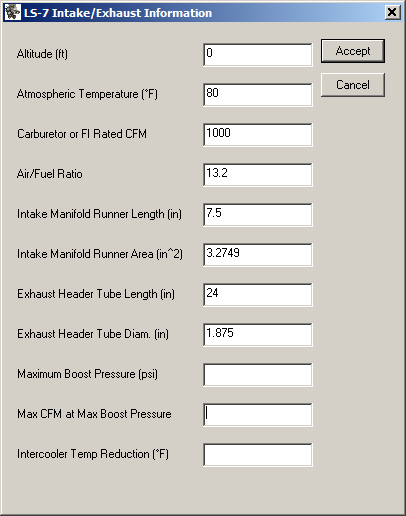
For the Intake/Exhaust module, the “Atmospheric Temperature” refers to the local ambient temperature. The AFR assumes you have jetted your carburetor to the entered value, but will change (lean out) if the rated CFM is inadequate. The plenum and tube lengths are important for determining the flow characteristics modeled from finite element Newtonian flow dynamics, with friction and flow momentum. For turbochargers and superchargers, there are entries for the “Maximum Boost Pressure”, “Max CFM at Max Boost Pressure”, and “Intercooler Temp Reduction.” A supercharged example, the LS9 corvette engine, is given at the end of this document to show performance estimates utilizing these fields.
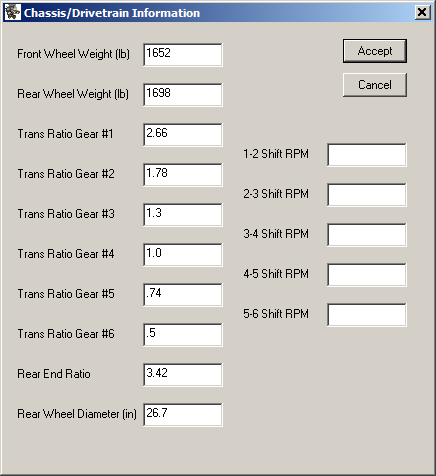
For the Chassis/Drivetrain module, notice that the vehicle total weight is divided between the weight at the front wheels and the weight at the rear. This is necessary for determining amount of wheel slip while drag racing. These weights can be easily determined by weighing the front and rear separately at your local truck stop weigh scale. Transmission gear ratios are also entered here. This information was obtained on the Internet for the 2006 Z06 Corvette, which has a 6-speed transmission. You can also enter your desired shift RPM through the gears for optimizing drag race performance with your engine designs.
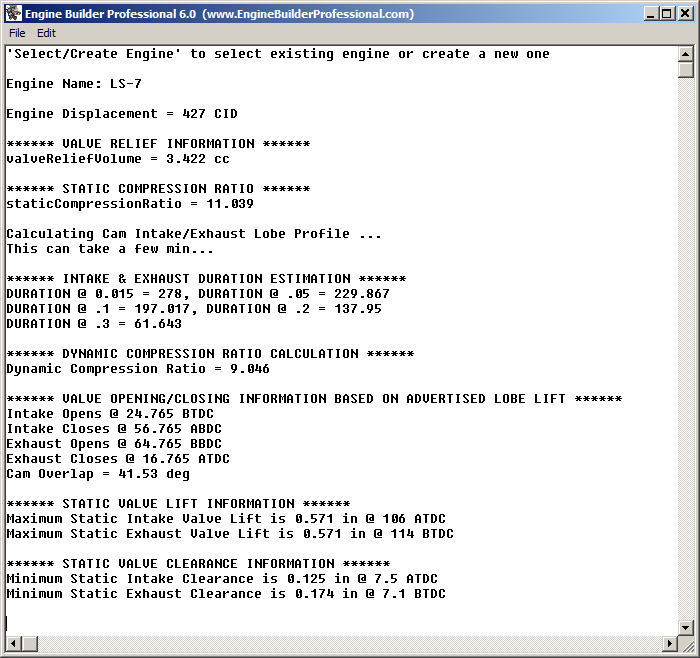
By hitting the Piston to Valve Clearance button in the main engine selection or creation window (first GUI), data will be written to the simulation window, including static and dynamic compression ratios, estimated valve opening and closing information, which should match your cam card, and the intake and exhaust piston to valve clearances. Not all the details of the LS7 engine could be obtained, such as the actual piston valve relief depths, so the clearance information is for display purposes only, but as entered this display shows sufficient intake and exhaust piston to valve clearance. Fortunately, the valve relief depths are available on pistons you buy from the manufacturer. More information on what is acceptable for clearances is presented later.
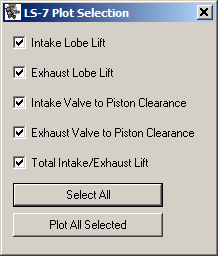
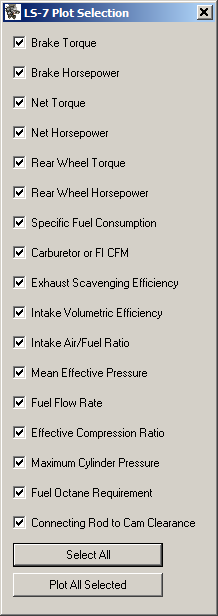
Once the Piston to Valve Clearance calculations are complete, a plot GUI shows up with the first plot selections available for analysis.
If all the plots are selected, then the following plots are displayed:
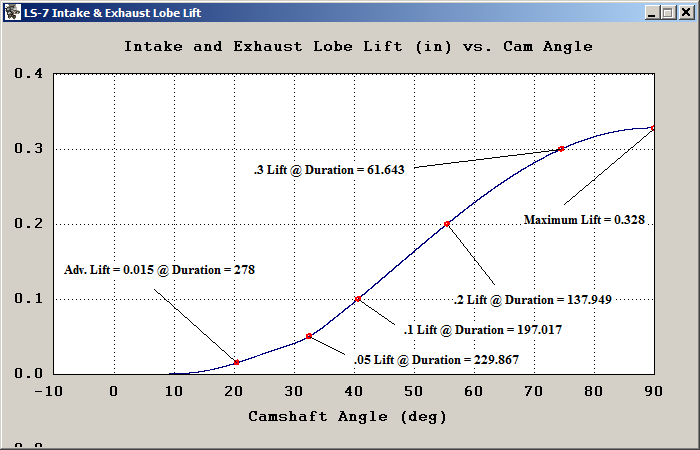
(1,2) Intake & Exhaust Lobe Lift
Since the intake and exhaust lobe profiles are the same for this particular cam, a combined plot of intake and exhaust is shown. This displays how the program estimated the complete lobe profile from the points entered using the spline fit generated by the program.
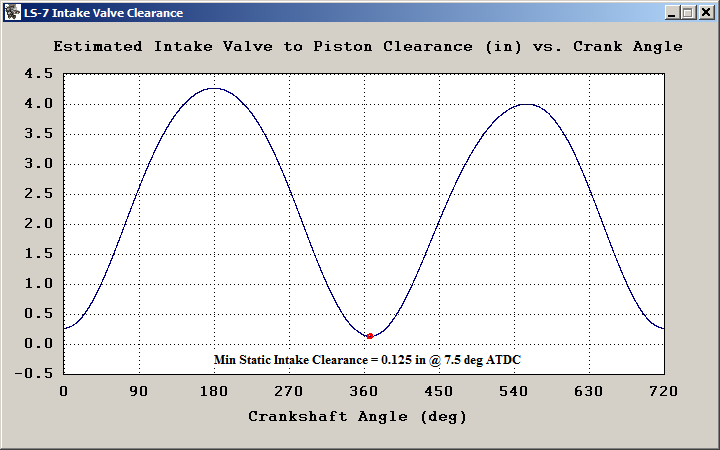
(3) Intake Valve Clearance
This plot displays the estimated intake valve to piston clearance throughout the complete engine cycle. It includes all the parameters entered including the deck height, head gasket thickness, piston valve relief's, etc., so it should be quite accurate; however, this is to give you an estimate and is not intended to circumvent using clay for the final assessment. Recommended minimum clearance depends on engine inertia, materials used, and temperature effects, but I have seen it as low as 0.080” for the intake valve. I would recommend a little more, but certainly the value given below of 0.125 is plenty. You can play with the head gasket thickness, cam timing, block deck height, and other related parameters and see this change.
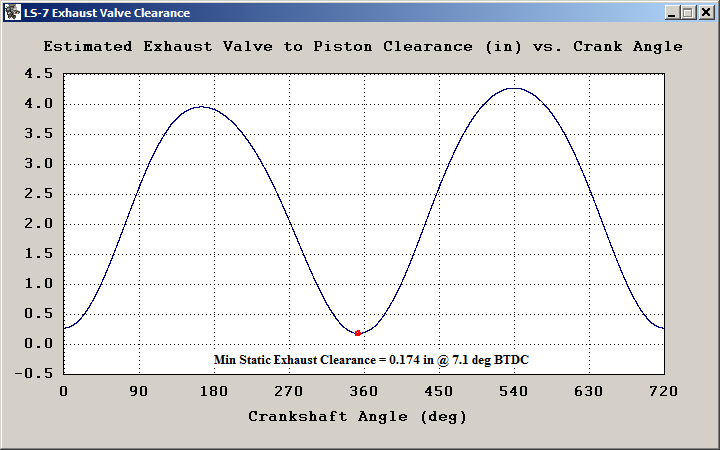
(4) Exhaust Valve Clearance
Here is the plot for the estimated exhaust valve clearance. I have seen values as low as 0.100”, but once again I would recommend a little more. Certainly the value given below of 0.174 is plenty.
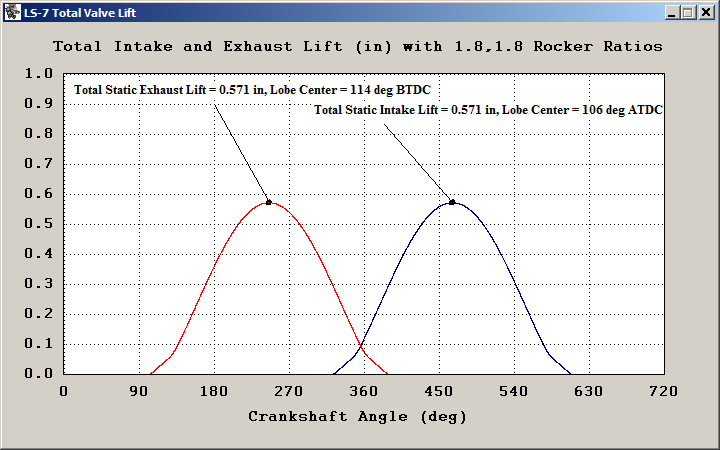
(5) Total Valve Lift
Here’s a plot of the total intake and exhaust lift including rocker ratios. It also shows the lobe separation and valve overlap. Valve overlap contributes to the intake and exhaust flow dynamics throughout the RPM range. Reducing the lobe separation, increases the overlap, reducing intake and exhaust efficiency at lower RPM, but increasing efficiency at higher RPM.
Now we can hit the Dyno Performance button. Data will again be written to the simulation window, including the estimated static connecting rod to camshaft clearance. Here the value is 0.098”. Consensus is that a clearance of 0.06 is sufficient. ALWAYS verify during assembly what the actual clearance is. Also shown is the compression test pressure, which for the LS7 is estimated here close to the actual of about 200 psi. The starter cranks the engine over a few revolutions to determine the test pressure, then fires normally based on the ignition timing until the RPM reaches the maximum, which can be entered as high as 8000. The LS7 has a redline of 7000 RPM. The time displayed is the simulation or engine time in seconds at full throttle under load on the dyno. Due to the extensive calculations, this run to 7000 RPM took about 5 minutes with the simulation. You will find that the required order of operations is “Piston to Valve Clearance”, “Dyno Performance”, and then “Drag Race Performance.”
Simulation display with graphics of engine dynamics as it runs
When the engine reaches it’s maximum RPM (Red Line) selected, the second plot selection GUI shows up with various performance and analysis plots to display.
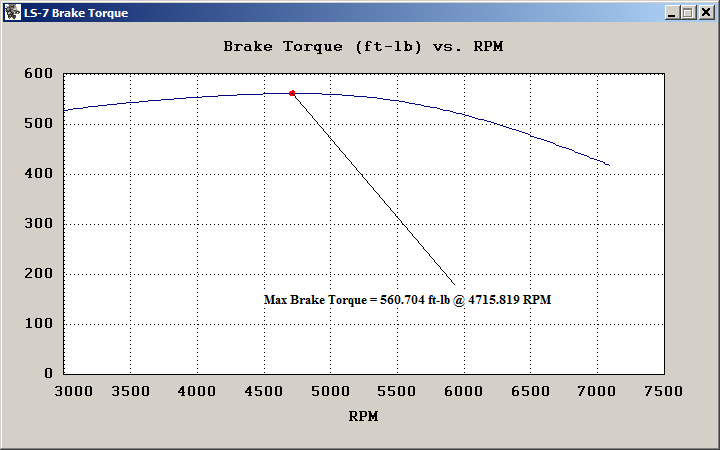
(1) Brake Torque
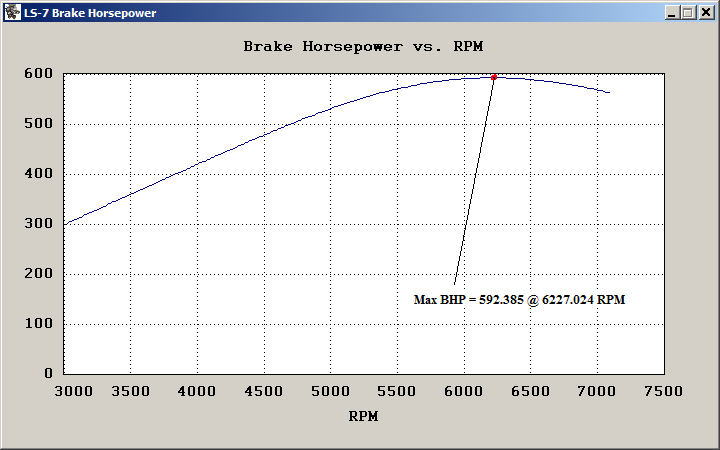
Brake Torque is measured at the flywheel, analogous to results from an engine dyno. It includes internal friction losses, but not engine accessories, intake filters, exhaust mufflers, or drive train losses in transmission, rear end, and wheels. Prior to 1972 this was the standard to rate engines called “SAE Gross.” After 1972, automakers began to quote torque/power in terms of “SAE Net”, which is still measured at the engine’s flywheel, but includes standard production-type belt-driven accessories and air cleaner, emission controls, exhaust system, and other power-consuming accessories. It’s impossible to exactly estimate the actual loss from Brake to Net to Chassis figures, but an attempt has been made that for the most part gives reasonable estimates for each. In 2005, the SAE introduced “SAE Cerified Power”, which is assumed for this purpose to be nearly the same as “Net.”
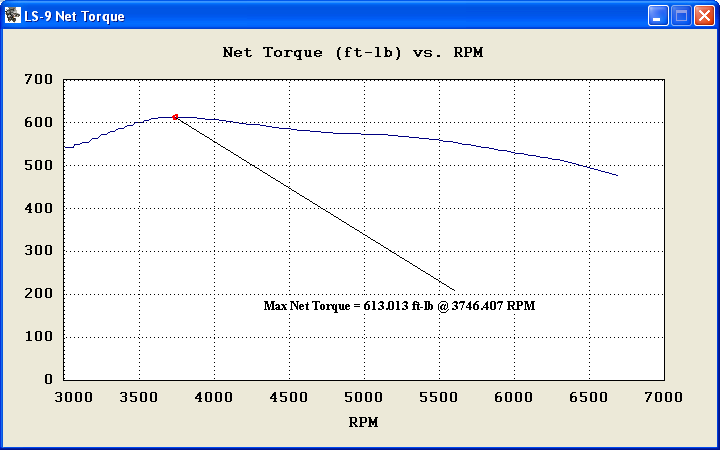
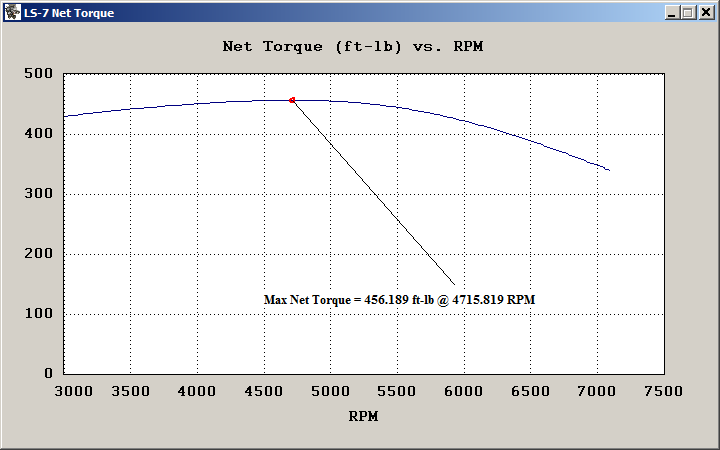
(2) Net Torque
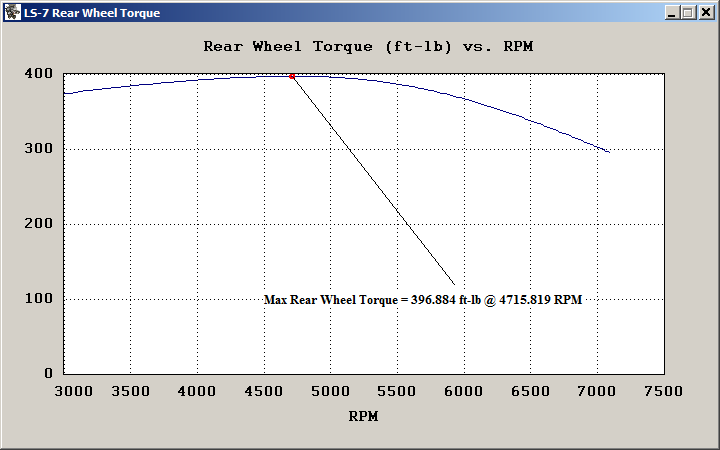
(3) Rear Wheel Torque
Rear Wheel Torque is measured at the wheels, analogous to results from a chassis dyno, and what’s used for the drag race performance estimates.
(4) Brake Horsepower
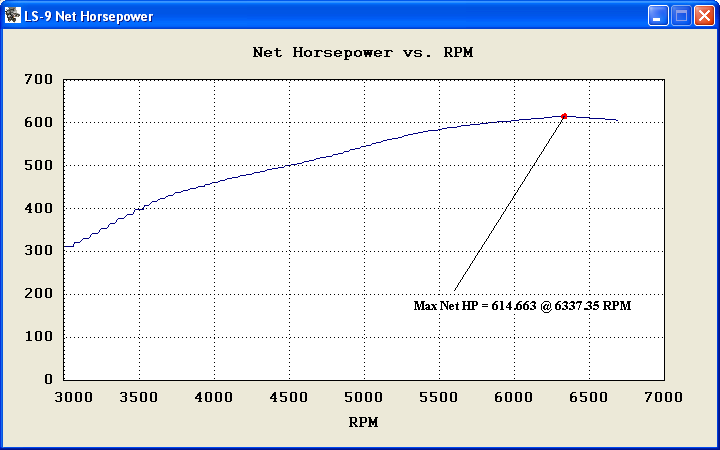
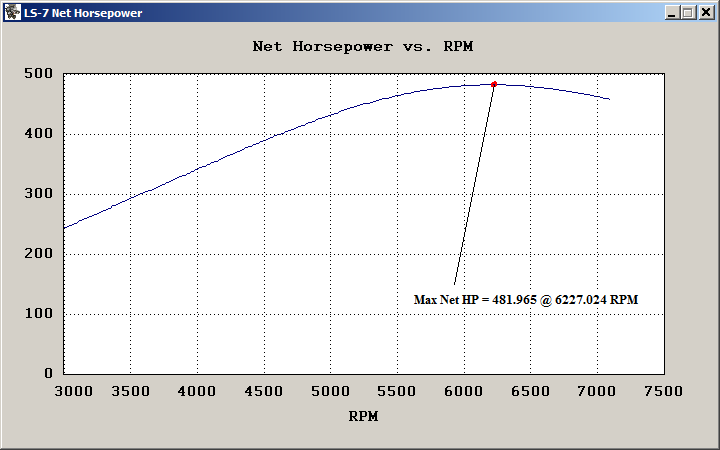
(5) Net Horsepower
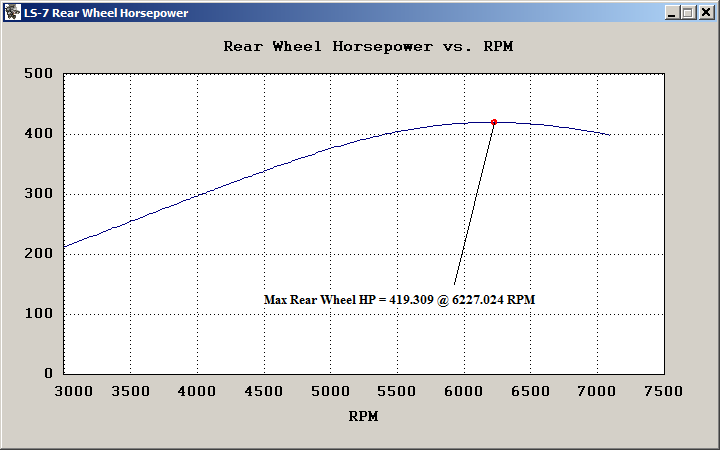
(6) Rear Wheel Horsepower
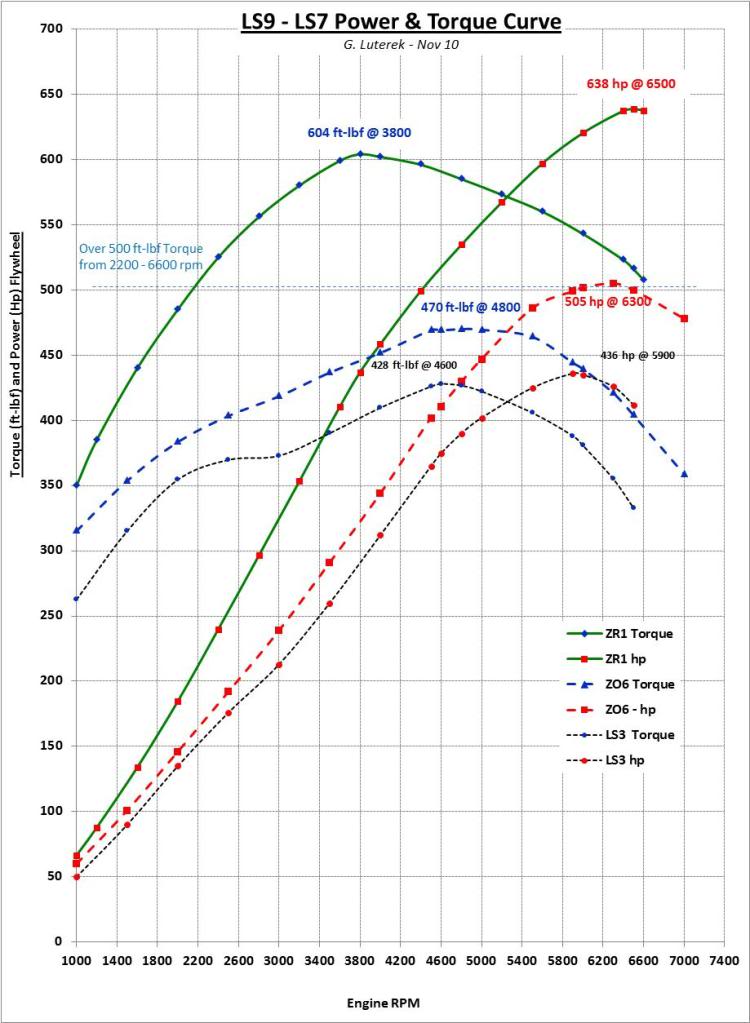
Below are plots showing a sample of the actual NET torque and horsepower for the Z06 LS7 engine and the ZR1 LS9 engine.
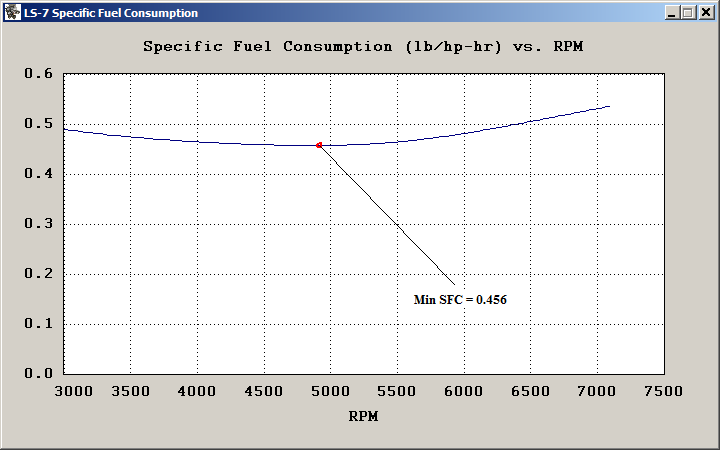
(7) Specific Fuel Consumption (SFC)
Specific Fuel Consumption is a measure of how effectively the engine is capable of converting fuel into power. The units are in pounds of fuel consumed per Brake Horsepower per hour of operation. Typical values are consistent with the plot below.
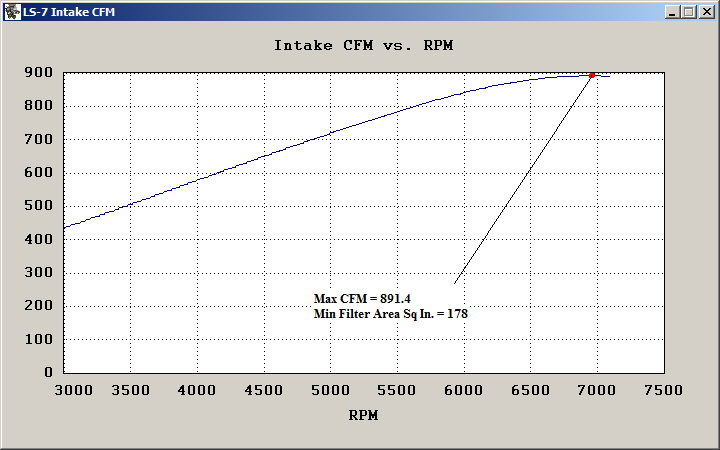
(8) Intake CFM
Intake CFM shows the engine air demand at atmospheric pressure throughout the RPM range. This gives you an idea of what carburetor rating you will need or fuel injection nozzles are required. If this engine had boost, it would be considerably higher. If you plan on doing any racing, I would recommend at least 1000 CFM for this engine and jet it or use appropriate injectors to achieve your desired air/fuel ratio, which is an input in the “Intake/Exhaust” module. This plot also displays the minimum air filter surface area. This uses the assumption that it can filter 5 CFM of air per square inch of filter area, which is pretty standard for most filters. K&N is a little better than this, but not significantly.
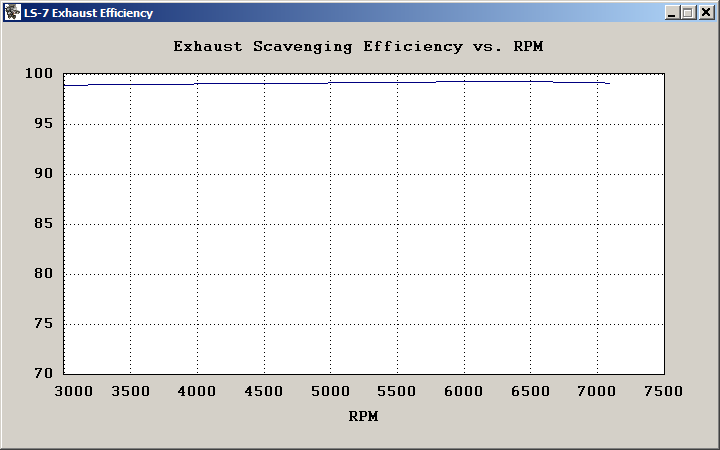
(9) Exhaust Efficiency
Exhaust Efficiency shows how effectively the engine is able to expel the spent exhaust gases out of the cylinder during the exhaust phase. This effects the combustion process and is sensitive to a multitude of factors, such as valve timing and lift, connecting rod ratio, exhaust head flow, exhaust port volume, header and exhaust pipe diameter and length, etc.
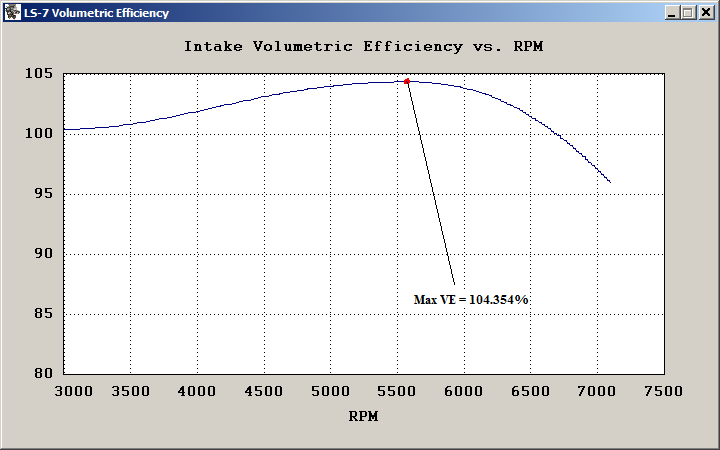
(10) Volumetric Efficiency
Intake Volumetric Efficiency shows how effectively the engine is able to draw in the intake charge during the intake phase. This also greatly effects the combustion process and is a function of many factors.
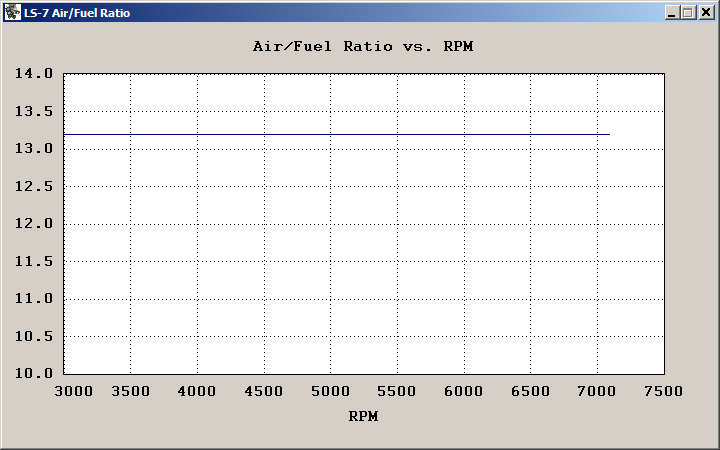
(11) Air/Fuel Ratio (AFR)
This is a pretty boring plot, only because the program assumes you can get the mixture right throughout the RPM range; however, if we would have entered smaller jets or nozzles and for this engine, or increased the red line significantly, then we would have seen the AFR lean out (increase) with RPM, which would indicate a deficiency.
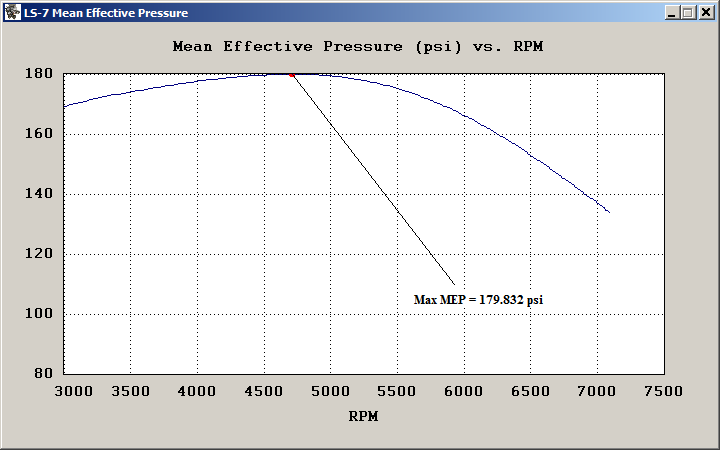
(12) Mean Affective Pressure (MEP)
Mean Effective Pressure, like SFC, is a common measure to compare engines. Values above 200 are only achieved in higher performance race engines.
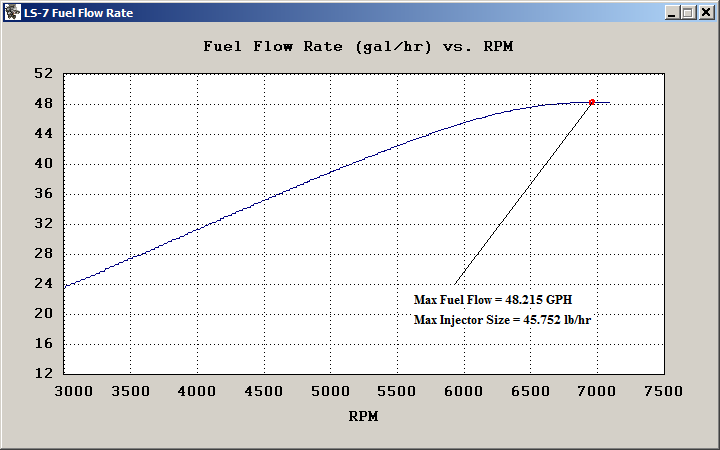
(13) Fuel Flow Rate
Fuel Flow Rate is the engine demand of fuel in gallons per hour. This helps you decide on a fuel pump. Most carburetors require 5-7 psi of pressure, and if you know the flow rate, you are all set. If you have fuel injection this program can also estimate the size of your injectors.
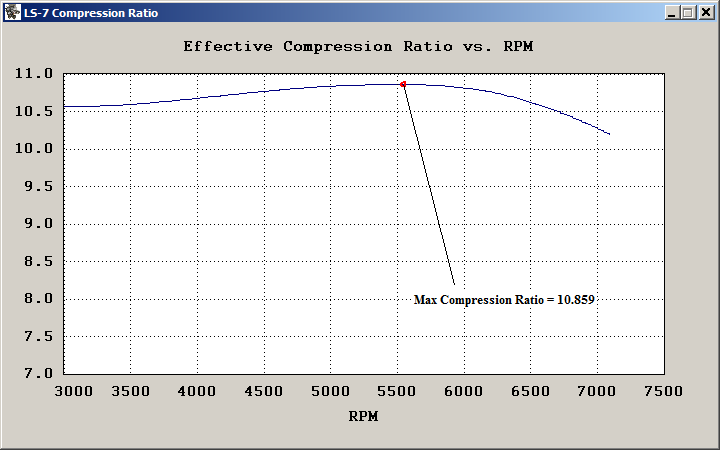
(14) Effective Compression Ratio
Effective Compression Ratio is a much better measure of fuel octane requirements for preventing detonation (ping or knock). Detonation results in extreme temperatures and pressures during combustion, causing extensive damage to engine components over time. Unlike static and dynamic compression ratios, which don’t change with RPM, the effective compression ratio does. It is more closely related to cylinder pressure prior to combustion, being a function of many factors, including altitude. That’s why available octane levels vary with the altitude of your city.
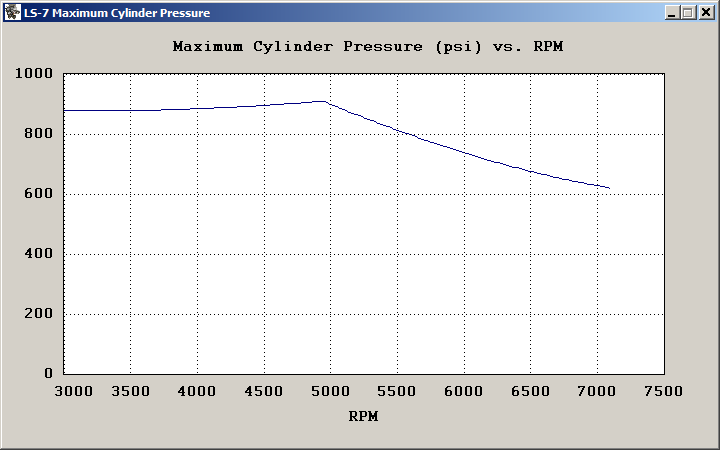
(15) Maximum Cylinder Pressure
This plot shows the maximum cylinder pressure that occurs after combustion vs. RPM.
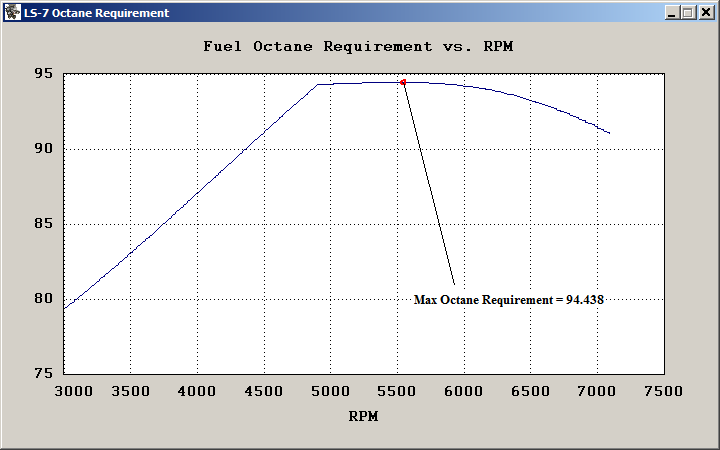
(16) Fuel Octane Requirement
This plot shows the estimate of the fuel octane required to prevent detonation. Several factors go into it’s calculation, such as temperature, altitude, compression ratio, ignition timing, AFR, etc. The elbow in the plot comes from the distributor ignition timing advance ramping entered. The recommended octane for the LS7 engine is 93 at sea level. Knock sensors and associated distributor advance control logic can only help you avoid detonation for an octane deficit of a couple of points. You certainly wouldn’t want to use 89 octane fuel at sea level with this engine.
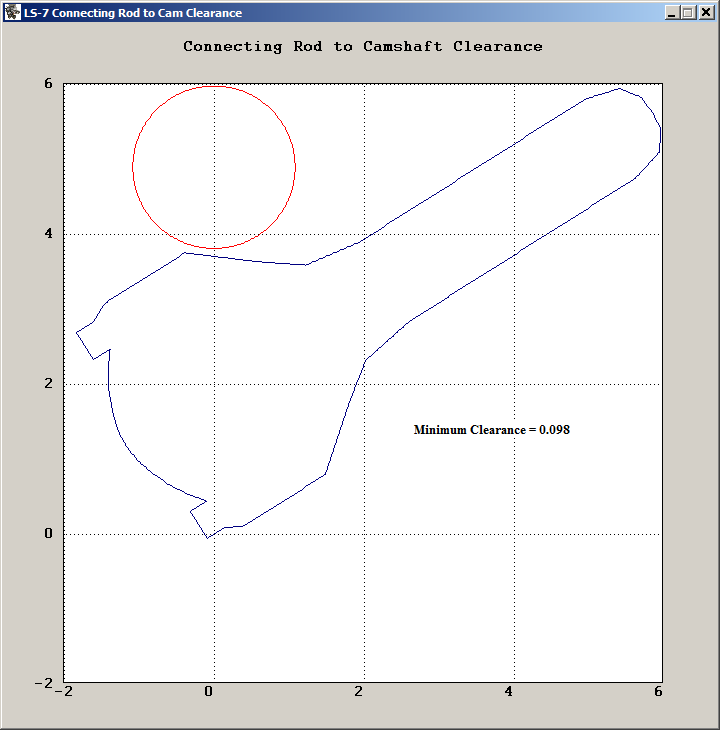
(17) Connecting Rod to Camshaft Clearance
This plot shows the estimated connecting rod to camshaft clearance. This is another one of those things like piston to valve clearance that can destroy an engine if not adhered to. The simulation is set up with default “acceptable” clearance of the connecting rod with the camshaft of 0.06”. The plot shows the position of both where the minimum clearance is attained to show where on the connecting rod you may want to shave to increase clearance to acceptable levels.
By hitting Drag Race Performance in the main engine selection or creation window, data will again begin to print to the screen displaying drag racing statistics, shifting the transmission at the maximum entered RPM redline.
And then the third and final plot selection GUI appears with plot options
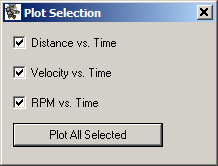
If all plots are selected, the following plots are displayed:
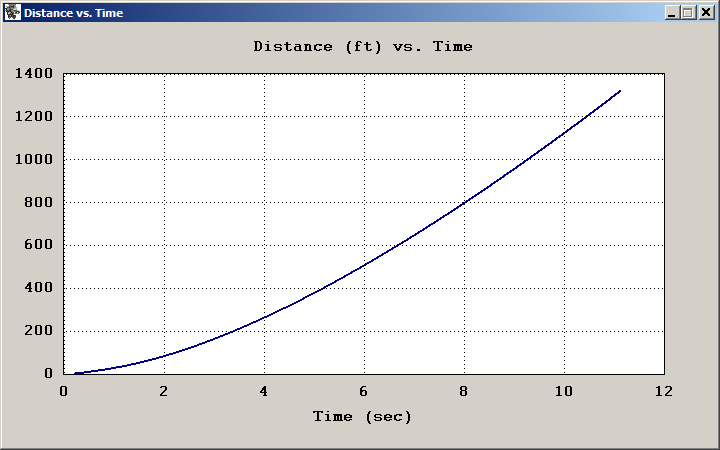
(1) Distance vs. Time
This plot shows the distance in feet traveled up to the quarter mile time
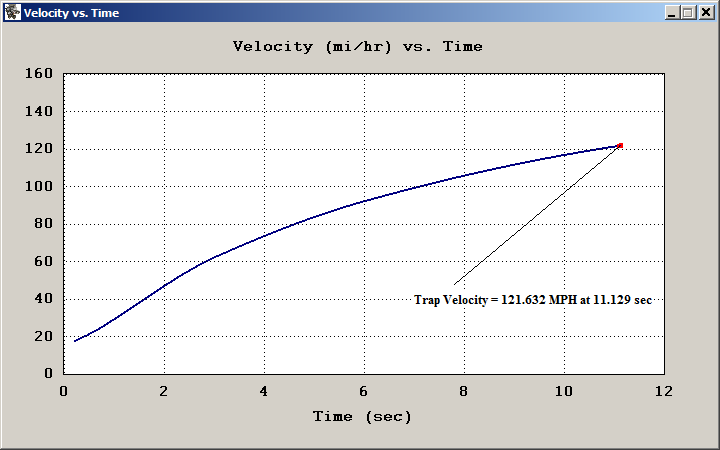
(2) Velocity vs. Time
This plot shows the velocity in mi/hr up to the quarter mile time
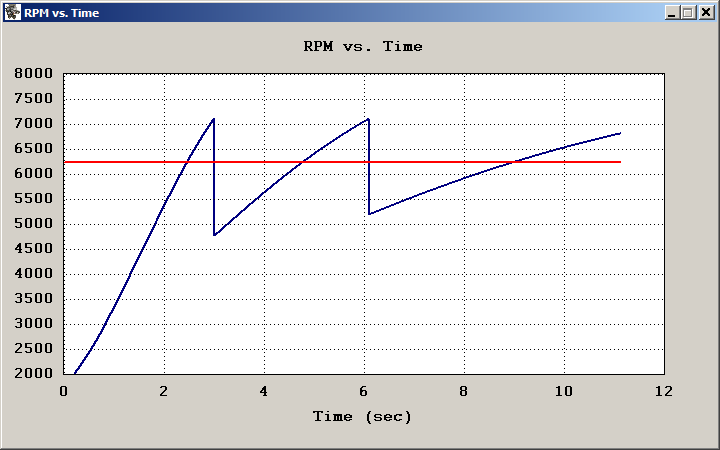
(3) Engine RPM vs. Time
This plot is very informative, in that it shows the shifting of the gears in relation to the entered redline engine RPM, and the RPM of maximum horsepower (red colored line). Ideally, you want the average RPM throughout the shifts to match the RPM of the maximum horsepower. In this case, the maximum entered RPM would have to be increased to about 7500 RPM to achieve this and gain the full potential of the quarter mile performance currently configured.
The LS9 is a supercharged 376 CID engine developed for the ZR1 corvette with a 140° F intercooler and 10.5 psi maximum boost at about 800 cfm. Below shows the simulation intake setup and Net Torque and Net Horsepower estimated by this tool, which compares somewhat favorably with the actual Power and Torque curves above for the ZR1 LS9.